Part of the OpX Platform
OpX Statistics: step-by-step statistical analysis
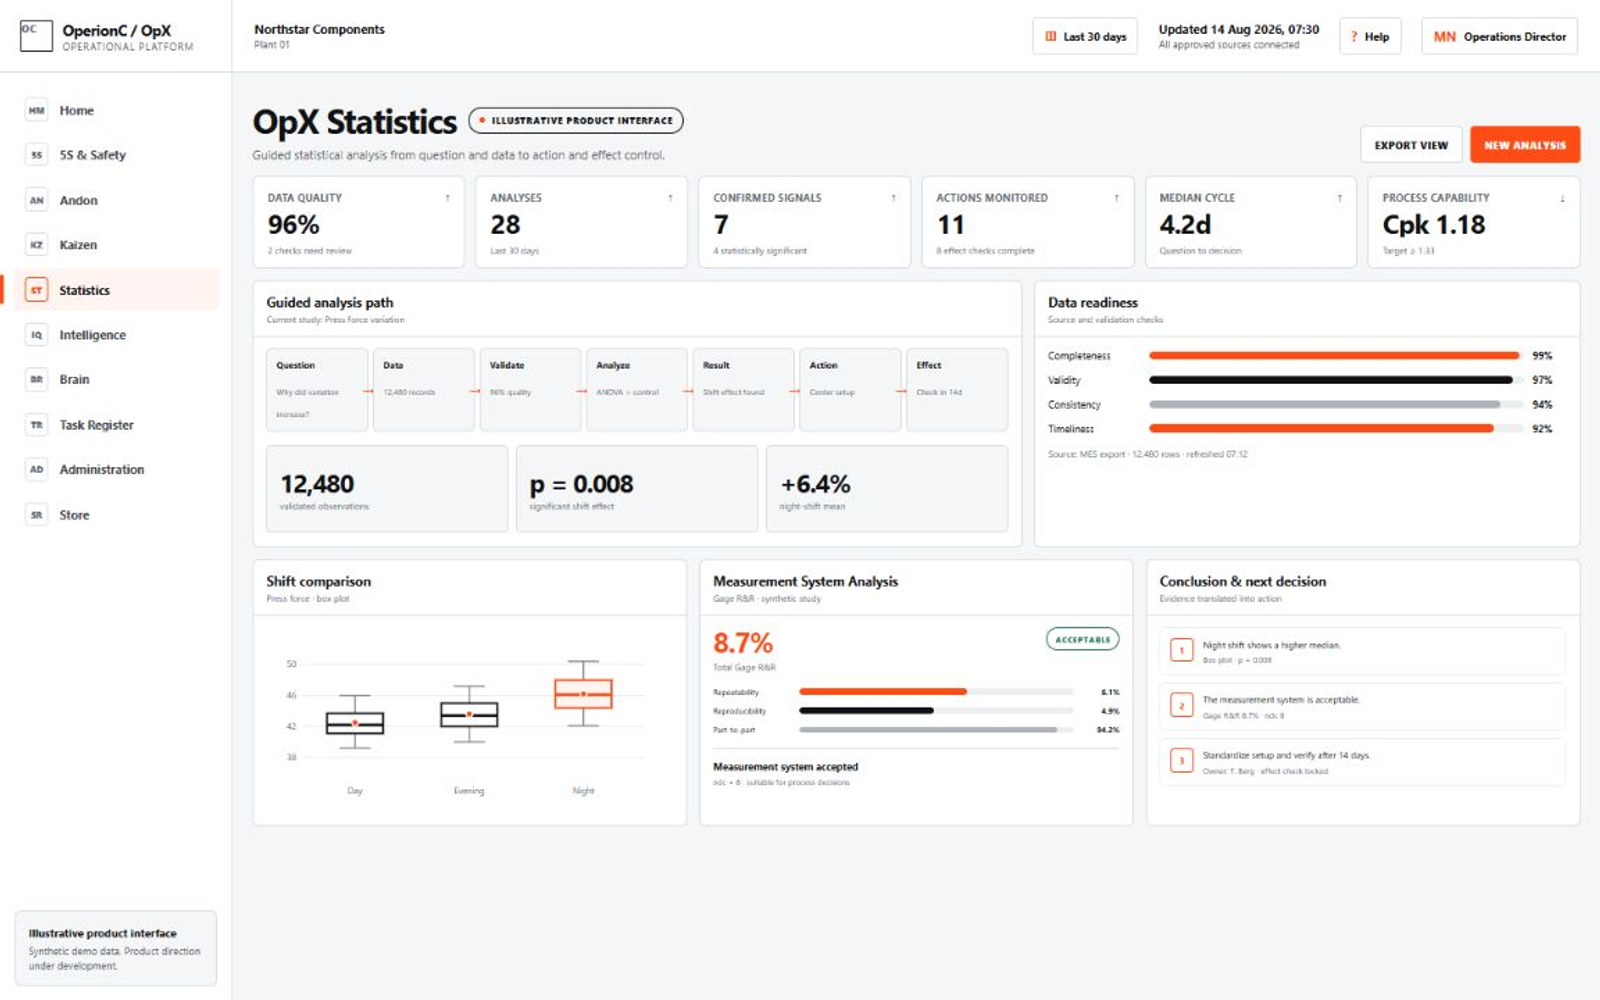
OpX Statistics guides teams from the question and source data through data-quality checks, the right method and clear conclusions to a measurable action plan.
What the module brings
OpX Statistics
The operational problem
Data does not make decisions on its own
Teams need the right statistical method and a clear interpretation of the result to distinguish a symptom from a likely root cause. OpX Statistics is a compact analytics tool with a conversational interface that guides users through the analysis without requiring specialist software expertise.
How it works
Ask. Check the data. Analyze. Decide
Define the question, check data quality, select the appropriate analytical method, receive a clear interpretation and verify the effect of the actions taken.
Business value
Statistics that business teams can understand and use as a sound basis for decisions
Simple deployment
Start with one operational question, without having to learn specialist statistical software
Measurement System Analysis (MSA), group comparisons, process stability and capability assessment, and analysis of relationships between variables.
Check whether the measurement system is reliable enough to support decisions.
Assess whether observed differences are real and meaningful for the process.
Review process behavior, capability and relationships between key variables.
Bring statistical confidence into daily improvement
Discuss how OpX Statistics could support your quality, process and continuous-improvement teams.